Physician Perspective
Administrative Burden
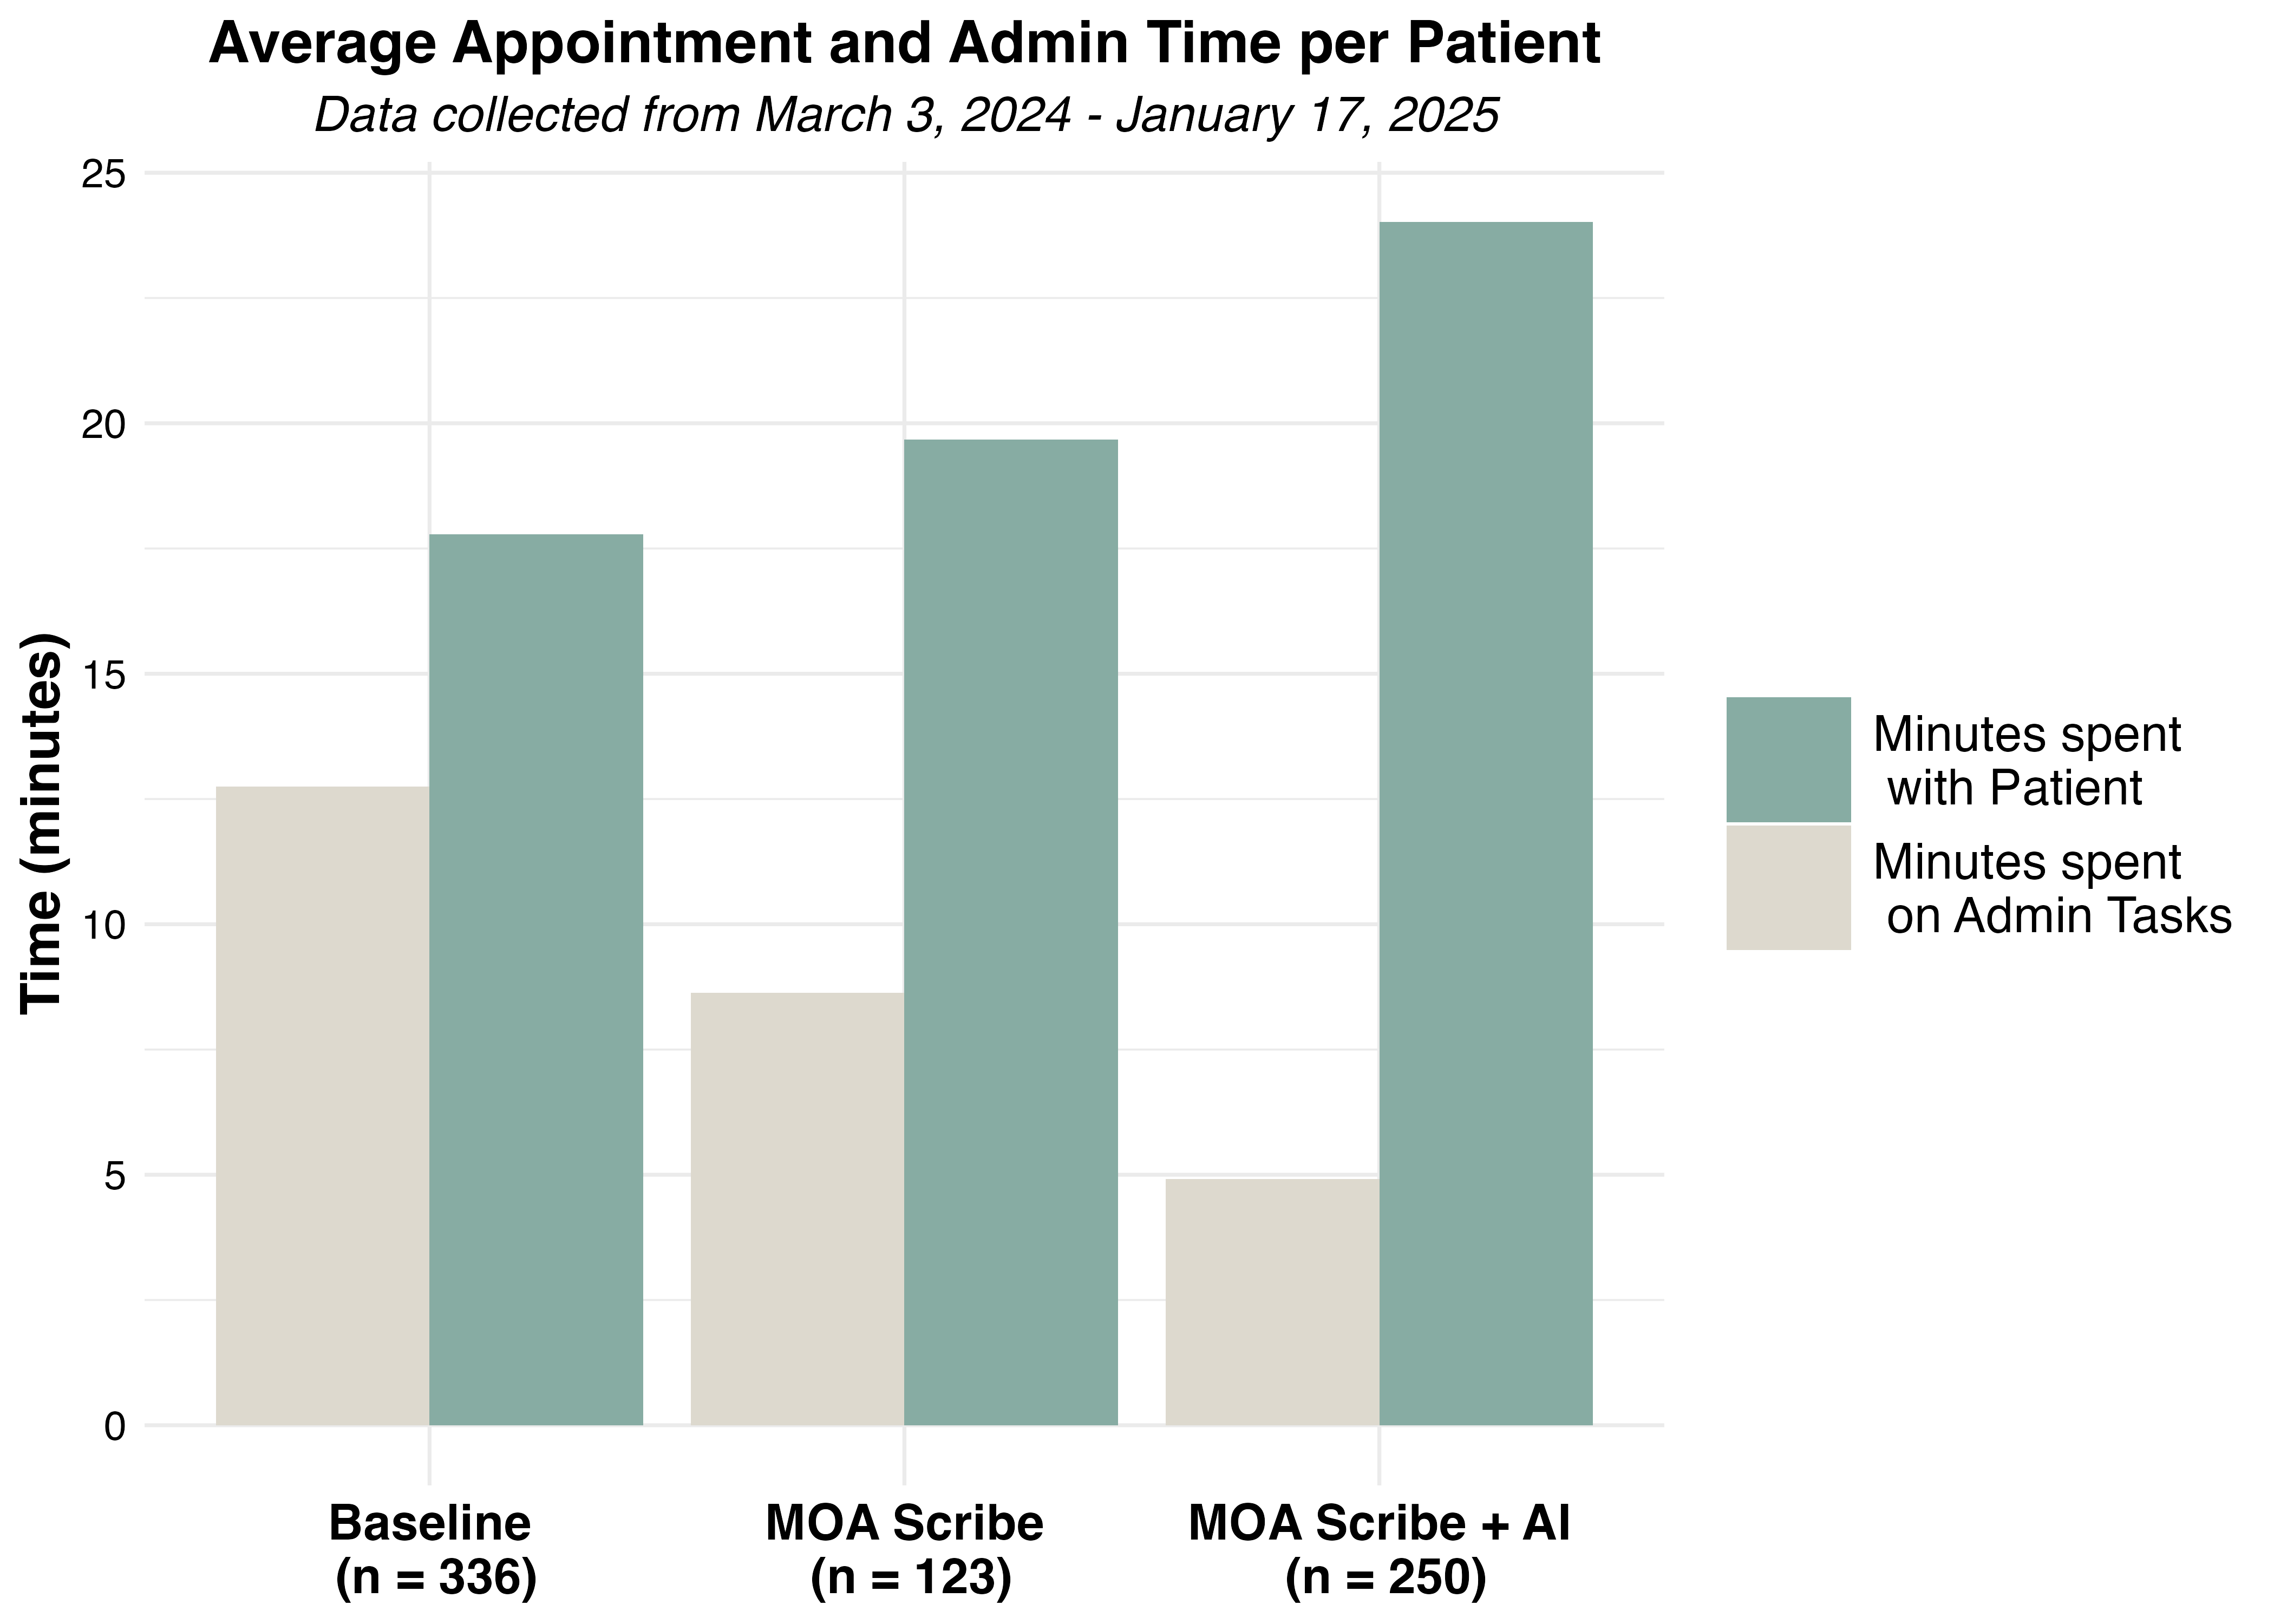
Figure 1. Daily time spent (A) on administrative tasks, (B) with patients, and (C) the ratio of patient:administrative time.
Since the implementation of the Patient-Centered Care Project at our pilot clinic, daily administrative time—defined as the time spent on charting, dictation, and billing—has been significantly reduced from 104 minutes to 44 minutes. Correspondingly, the time allocated to direct patient care has increased from approximately 2.5 hours per day to 3.2 hours per day. This shift has resulted in a substantial improvement in the patient-to-administration (P:A) time ratio, increasing from 1.4 prior to the project’s initiation to 4.8 at the 4-month mark.
Additionally, we evaluated the relative efficiency of a human scribe versus the combined use of a human and AI-assisted scribe. Following the integration of the AI scribe, there was a further reduction in daily administrative time compared to using a human scribe alone leading to even greater enhancements in the P:A time ratio, as indicated in the figure by the second vertical marker.
Burnout & Job Satisfaction
Physician Fulfillment
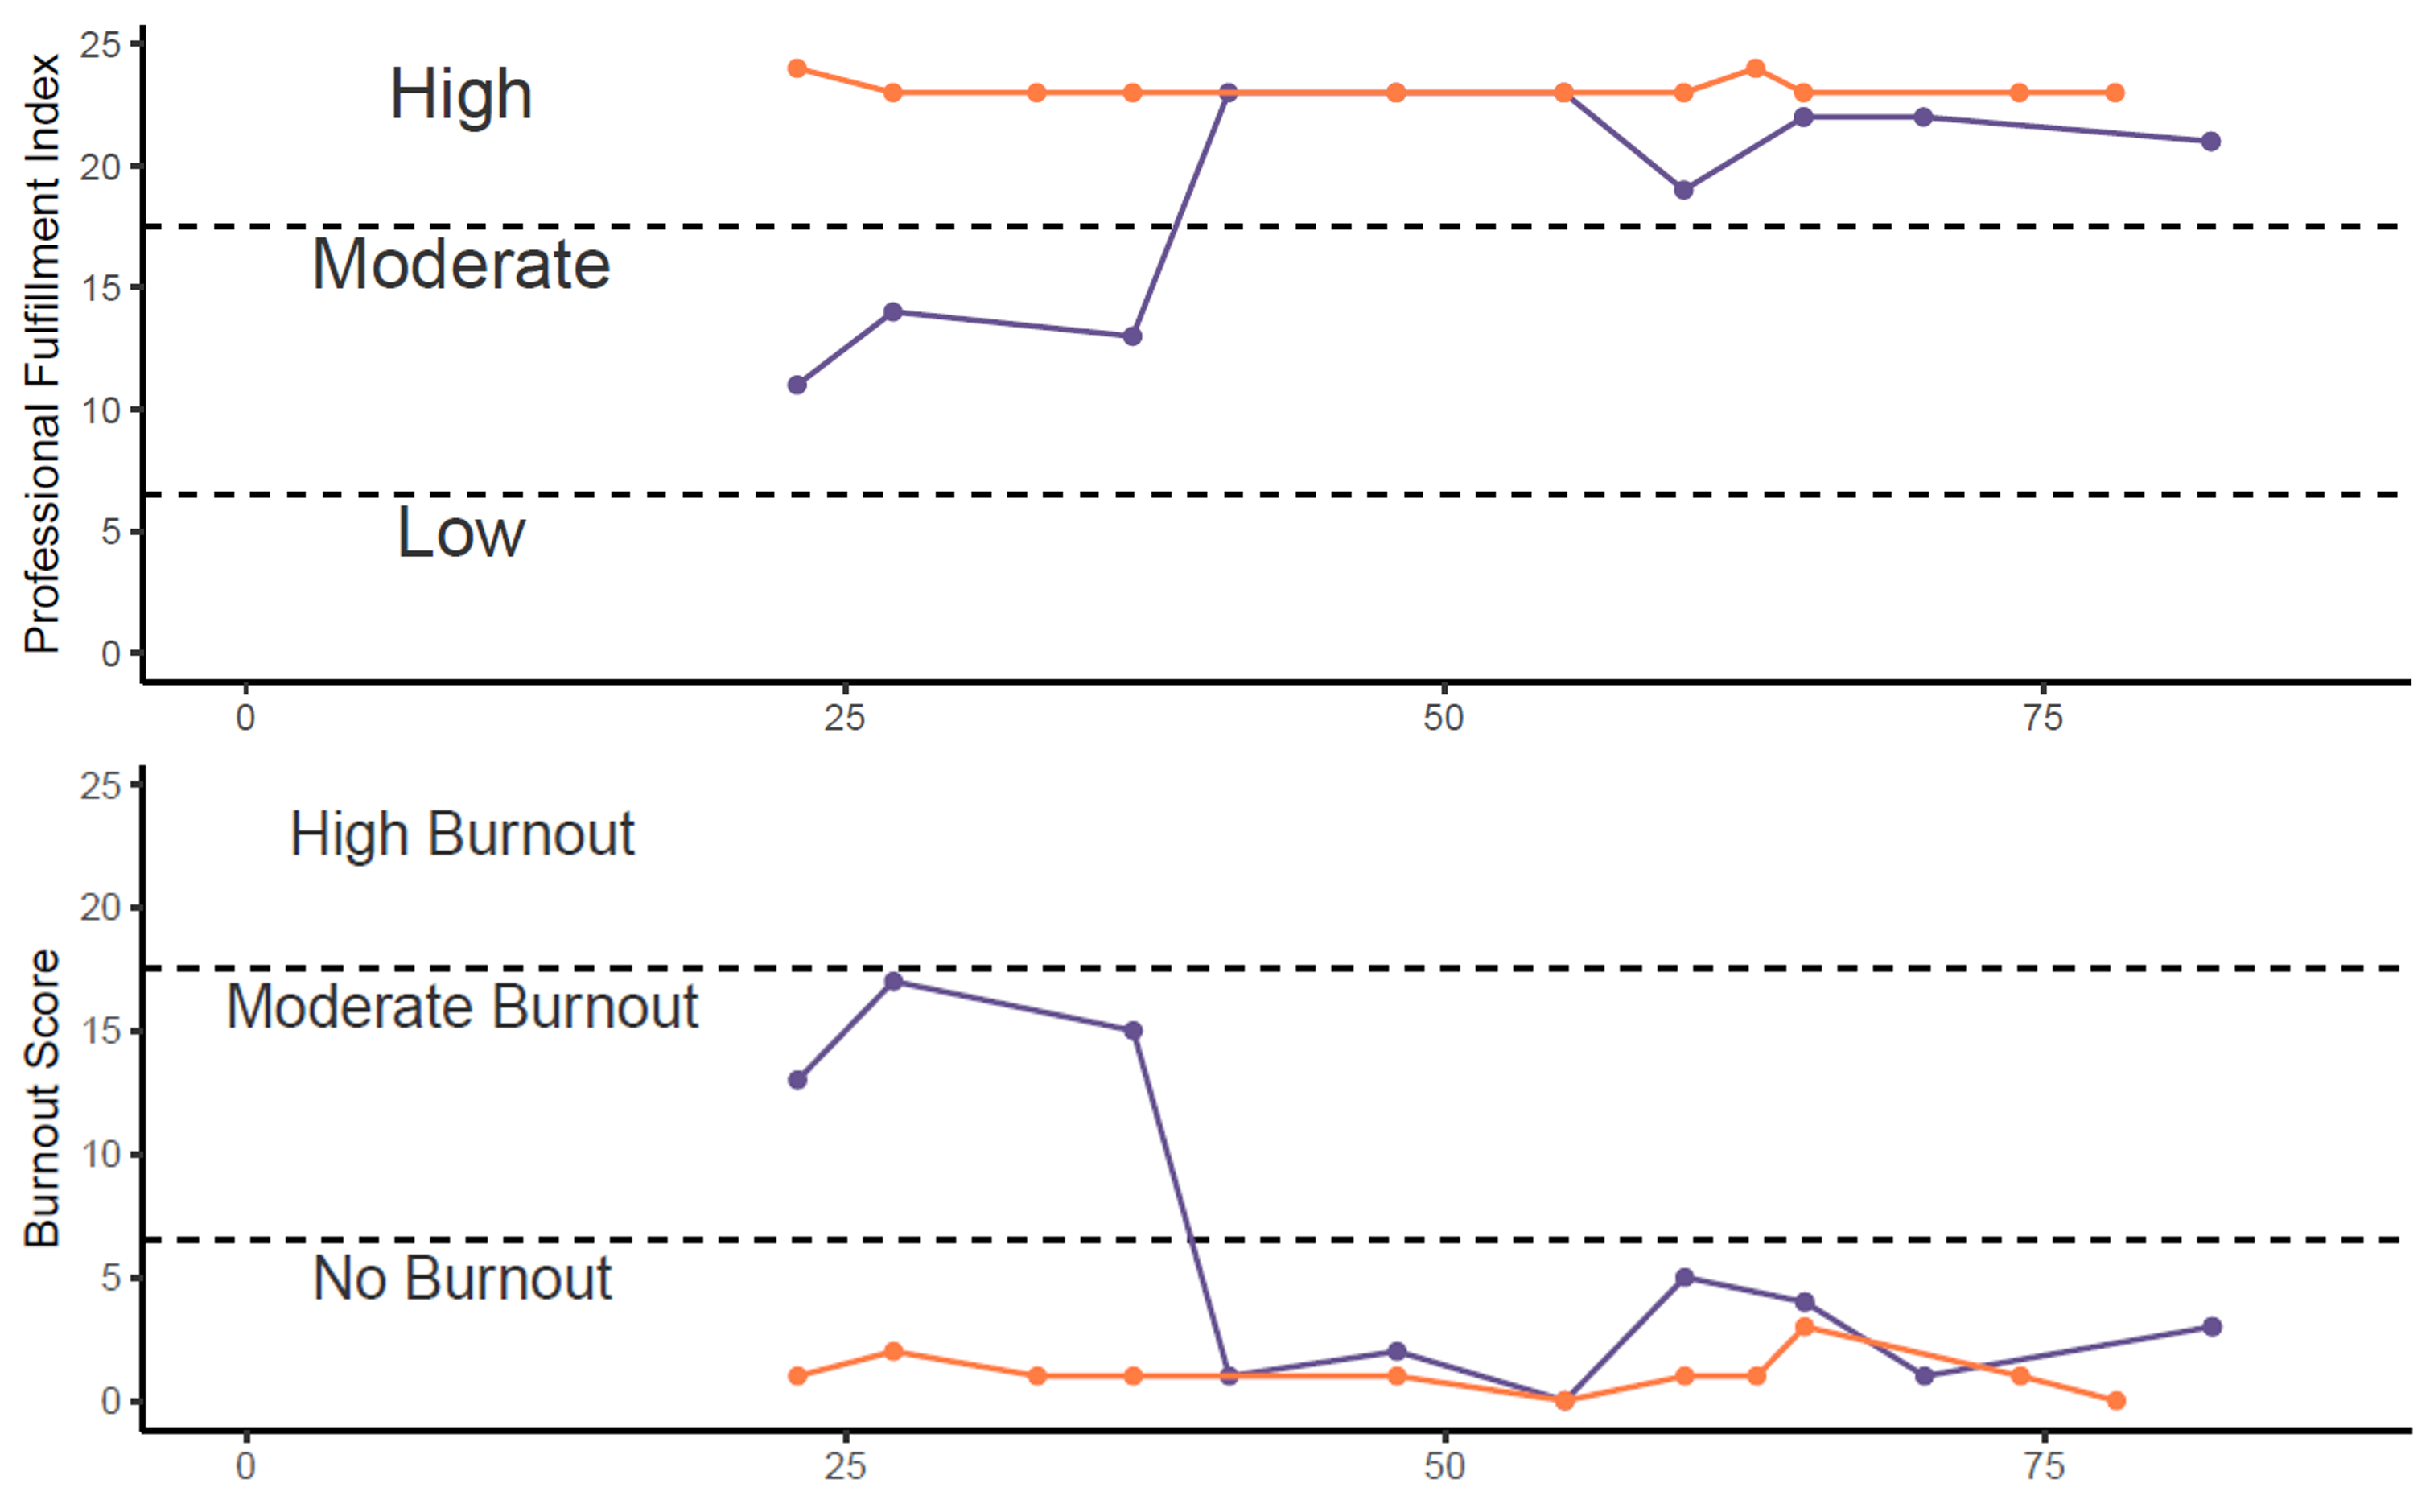
Figure 2. Scores of Physician (A) Burnout and (B) Job Satisfacrtion.
To ensure the changes in daily administration time were having a meaningful impact on feelings of burnout, physicians were asked to fill out the Professional Fulfillment Index, a survey proven to be effective in assessing acute changes in both burnout and job satisfaction. Job satisfaction is a key protective factor in preventing burnout and, as such, is important to capture. Prior to the start of the project, the physician experienced moderate levels of burnout along with moderate levels of job satisfaction. Following implementation of the Patient Centered Care Project, the physician experienced reductions in burnout to a score of nearly 0, while also having high levels of job satisfaction. Together, these metrics suggest that the changes in the P:A ratio reduce burnout levels and help to protect physicians from further burnout.
MOA Fulfillment
As part of the Patient Centered Care Project, the Medical Office Assistant is asked to take on additional administrative duties (i.e. monitoring the AI scribe) while also spending more time in a patient forward role. As these tasks are typically beyond that required for their, it was important to ensure they were not experiencing any unintended adverse impacts to their own feelings of burnout and job satisfaction. We therefore asked the MOAs to additionally fill-out the Professional Fulfillment Index. Importantly, there was no change in levels of burnout or job fulfillment following the implementation of the project.
Patient Perspective
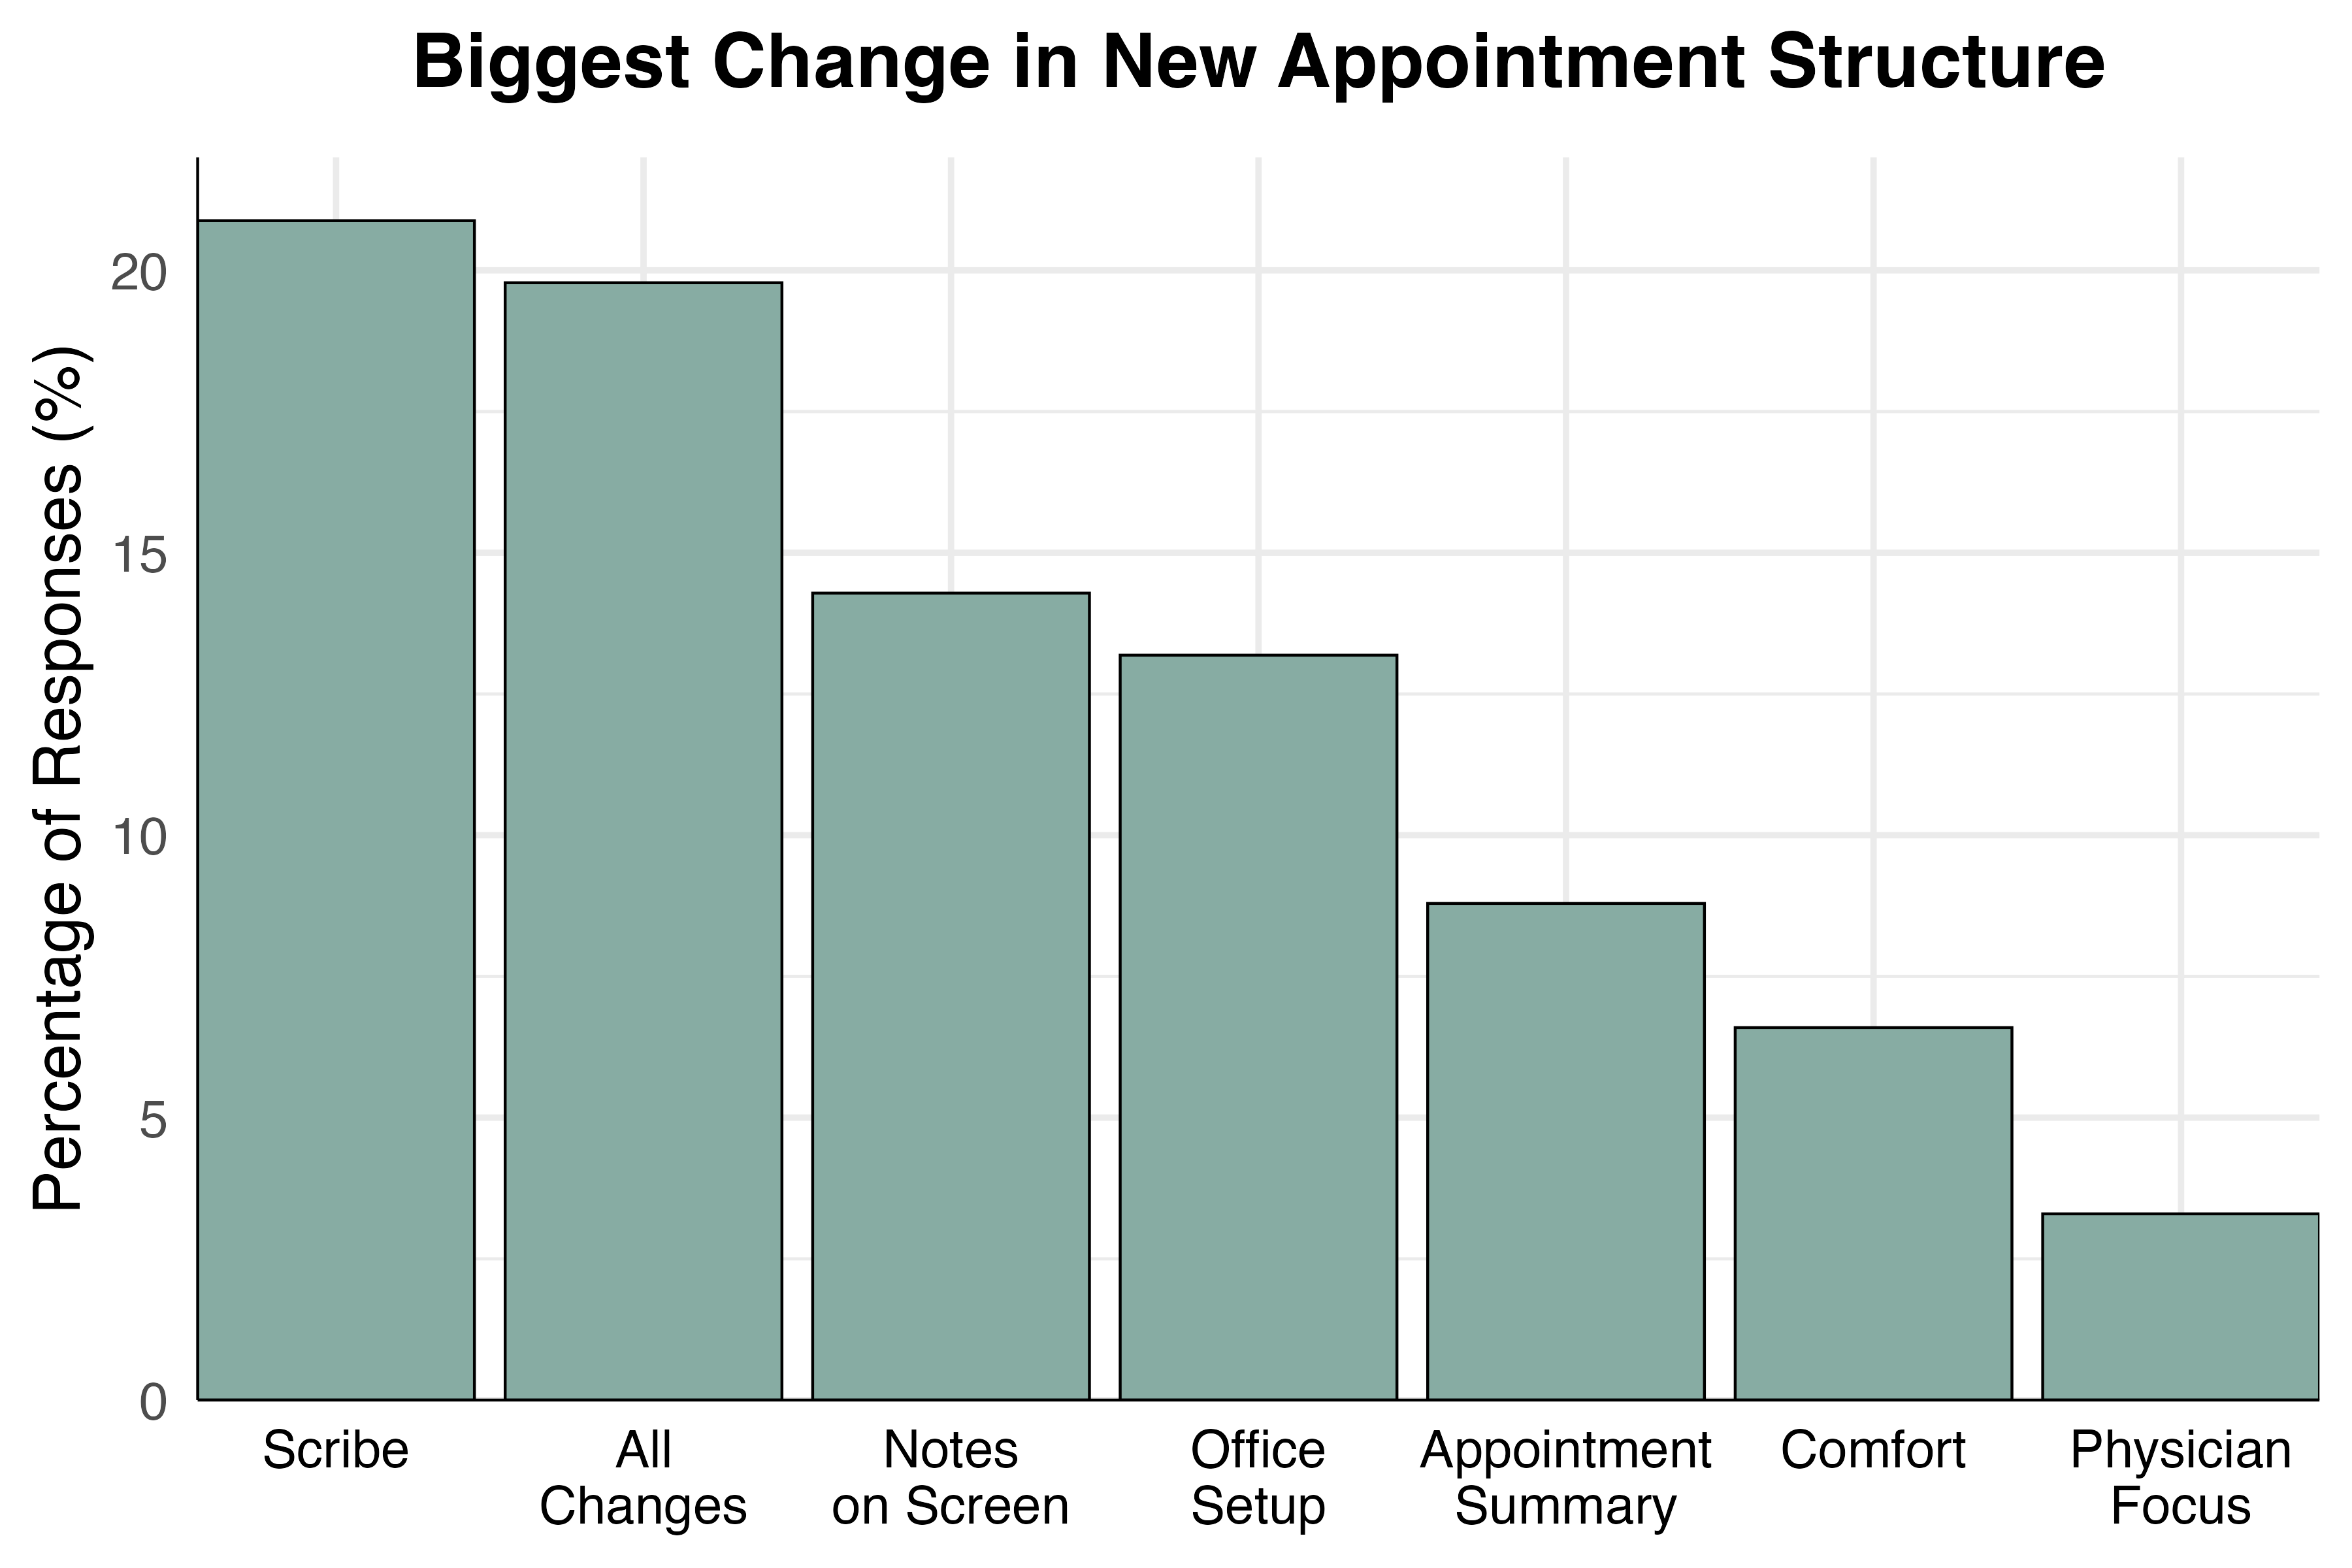
Figure 3. Percentage of respondents that listed the respective change as the biggest difference in their appointment.
At the core of the project is empowering patients to be champions of their own health care journeys by receiving the highest quality of care. We designed a questionnaire collaboratively with patient partners to ensure that the inclusion of both the human and AI scribe did not negatively impact the patient's experience. Overall patient experience was also assessed to ensure that the changes made as part of the project were helping the patient as well as the medical team. 99% of patients did not find the inclusion of the scribe to be intrusive or disruptive. In fact, most patients reported the use of the scribe as one of the highlights of the project, describing the consequent improved physician attention as making a meaningful improvement to their appointment.
Overall Patient Experience

Figure 4. Responses from patients on their overall experience both prior to (top) and following (bottom) project implementation.